Large scale assessment of the importance of karst regions for human water security under current and potential future conditions
|
Funded by the German Academic Exchange Service (DAAD)
Within the next 100 years global temperatures and precipitation are expected to change significantly, also in karst regions. The forcings for large scale karst simulation models are readily available. But difficulties in the assessment of model parameters at such scales still prohibit large scale applications. This lack of knowledge still prohibits large-scale assessment of present and future groundwater recharge in karst regions. |
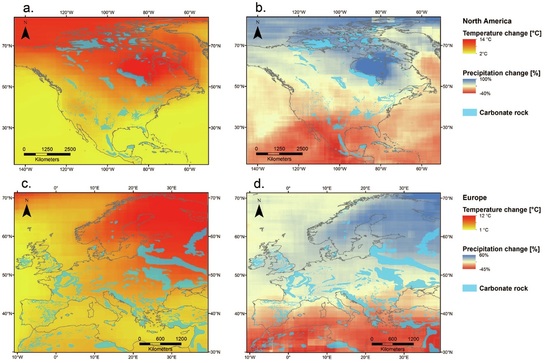
Expected mean change of temperature and precipitation in (a and b) North America and (c and d) Europe from 1961–1990 to 2081–2090, derived from 20 general circulation models (Hartmann et al., 2014, RoG)
|
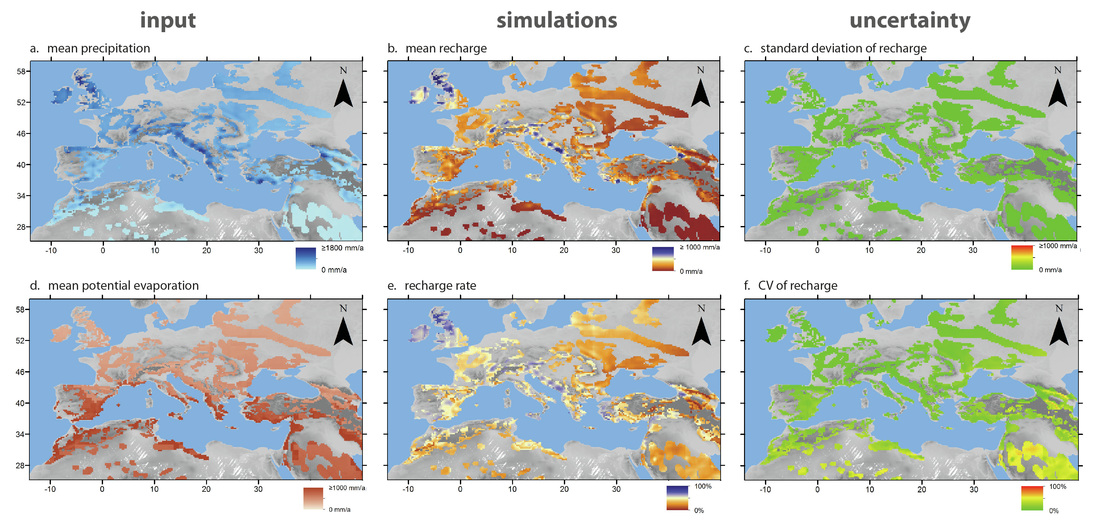
In the first part of this project project, new simulation and regionalization methods to simualte karstic groundwater recharge on large scales were developped and published (Hartmann et al., 2015, GMD).
Observed precipitation and (d) potential evaporation versus the simulated (b) mean annual recharge and (e) mean annual recharge rates derived from the mean of acceptable 250 parameter sets, and (c) the standard deviation and (f) coefficients of variation of the simulations due to the variability among the 250 parameter sets for the period of 2002-2012 (Hartmann et al., 2015, GMD)
|
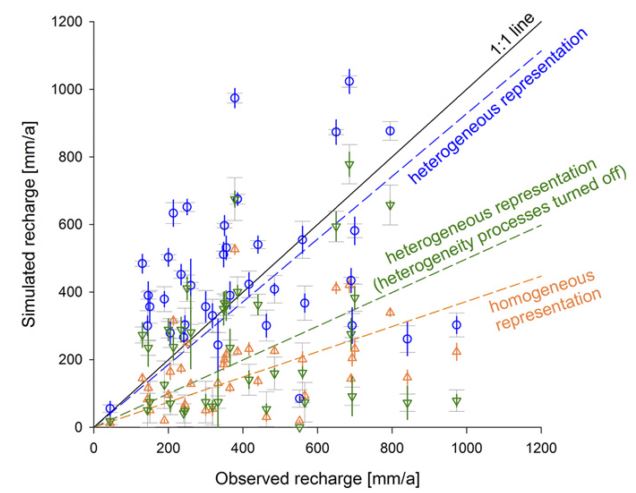
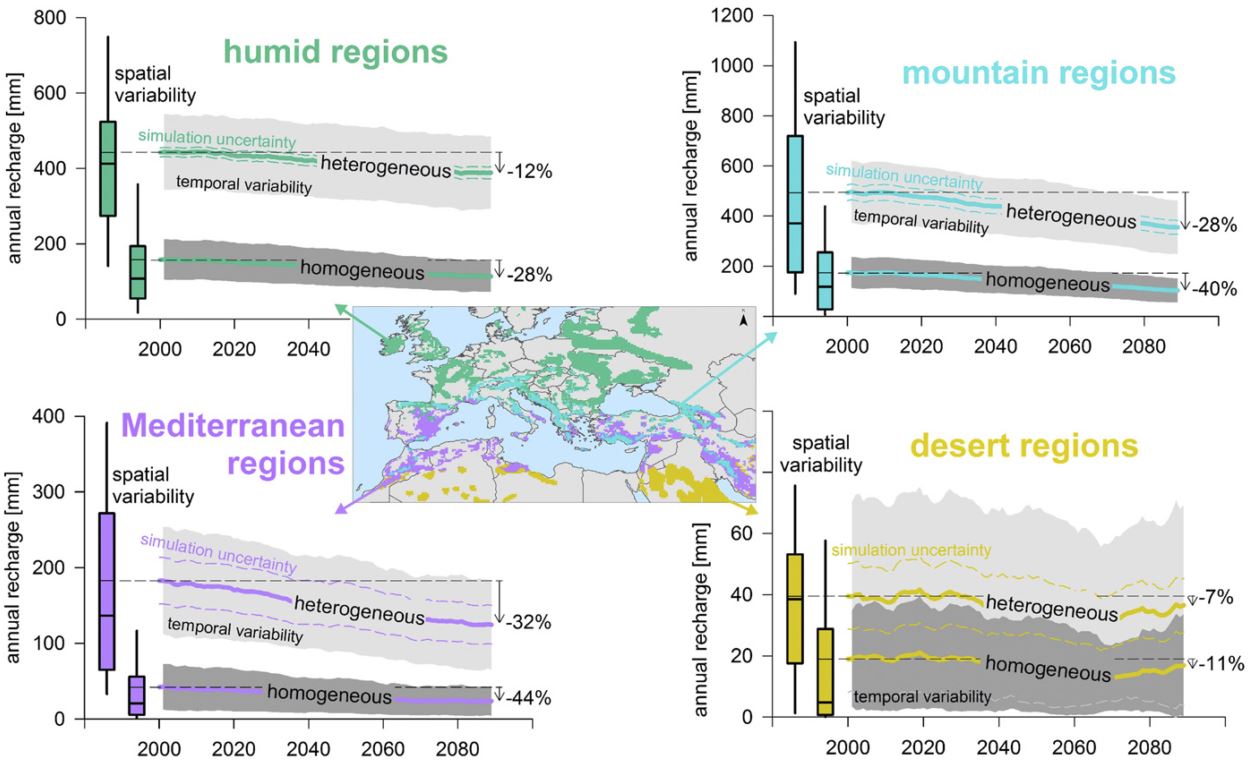
The second part of the project focussed on the application of the new approaches, (1) comparing them with the outcomes of commonly applied large-scale models that do not include heterogeneous karst processes and with orecharge observations and (2) by predicting future groundwater recharge in karst regions using the new model and gain on eof the commonly applied large-scale models (Hartmann et al., 2017, PNAS).
|
Simulated recharge volumes of the heterogeneous model (VarKarst-R), the homogeneous model (PCR-GLOBWB), and the heterogeneous model with subsurface heterogeneity processes turned off plotted against observed recharge volumes (Hartmann et al., 2017, PNAS)
|
Simulation results for the two subsurface representations for four regions; spatial variability within each region for the present (1991–2010) is presented by the boxplots; temporal evolution of recharge rates is expressed by a 20-y moving average (centered around its mean year, for instance the year 2000 for the 1991–2010 average); temporal variability within each 20-y window is expressed by its SD indicated by the gray shading around the mean (gray dashed line represents lower boundary of the heterogeneous model temporal variability at the desert regions); simulation uncertainty of the heterogeneous model due to parameter uncertainty is indicated by the dashed lines around the mean recharge (Hartmann et al., 2017, PNAS)


