SHORT DESCRIPTION
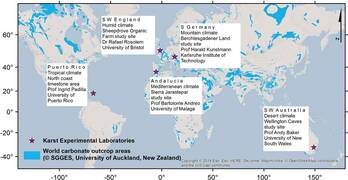
The work package 2 deals with the understanding of karst recharge processes at the surface. Using a dense network of soil moisture monitoring stations and frequent sampling of soil water stable isotopic composition at 5 karst experimental laboratories (KELs) in different climate regions around the globe the heterogeneity of karst recharge processes will be quantified, and incorporated into catchment scale groundwater recharge models.
Characterization of infiltration through the epikarst: Preliminary analysis of isotopic data and soil moisture at the Villanueva del Rosario site
IN DETAIL: FULL REPORT
Sampling and Analysis of Stable Water Isotopes in Soil Water
Sampling and Analysis of Stable Water Isotopes in Soil Water
Romane BERTHELIN
Solange THEODORE
Solange THEODORE
MOTIVATION
In May 2019, a field campaign was carried out at the European GloW test sites, in Spain, the UK and Germany. The aim was to collect soil samples to measure stable water isotopes from the soil water. The second round of sampling was supposed to happen in March 2020, but because of the Corona Virus situation, all fieldwork was canceled. Why measuring stable isotopes from the soil water is interesting for us? In 2018, a soil moisture measurement network was installed at 5 different karst experimental laboratories (KELs) across the globe. Studying soil moisture evolution with depth above karst would allow improving the knowledge about the role of soil in karst recharge processes. Climate and vegetation influence are also included in the recharge processes exploration as the experiment is repeated under different climates and land cover types (forest and grassland areas). To describe water flow in the vadose zone and thus estimate recharge, soil physical models can be used. According to Sprenger et al. 2015, measurement of pore water stable isotope profiles combined to soil moisture time series measurement would allow a better parameter determination for modelling. Indeed, water isotopes are used as natural tracer. Measured in the water from the soil pore and combined to the rainfall water isotopic signal, it can bring information on different hydrological processes as infiltration, evaporation, transpiration and percolation (Sprenger et al. 2016). The temporal variation of the isotope signal and the signal modification due to hydrological processes can be tracked in soil profiles. This is why we wanted to measure stable water isotopes in the soil water at our site, where soil moisture is already measured at a temporal resolution of 15 minutes. These measurements were conducted at our three European. In the rest of the article, the experiment conducted at the site Villanueva del Rosario in Spain will be presented and taken as an example.
In May 2019, a field campaign was carried out at the European GloW test sites, in Spain, the UK and Germany. The aim was to collect soil samples to measure stable water isotopes from the soil water. The second round of sampling was supposed to happen in March 2020, but because of the Corona Virus situation, all fieldwork was canceled. Why measuring stable isotopes from the soil water is interesting for us? In 2018, a soil moisture measurement network was installed at 5 different karst experimental laboratories (KELs) across the globe. Studying soil moisture evolution with depth above karst would allow improving the knowledge about the role of soil in karst recharge processes. Climate and vegetation influence are also included in the recharge processes exploration as the experiment is repeated under different climates and land cover types (forest and grassland areas). To describe water flow in the vadose zone and thus estimate recharge, soil physical models can be used. According to Sprenger et al. 2015, measurement of pore water stable isotope profiles combined to soil moisture time series measurement would allow a better parameter determination for modelling. Indeed, water isotopes are used as natural tracer. Measured in the water from the soil pore and combined to the rainfall water isotopic signal, it can bring information on different hydrological processes as infiltration, evaporation, transpiration and percolation (Sprenger et al. 2016). The temporal variation of the isotope signal and the signal modification due to hydrological processes can be tracked in soil profiles. This is why we wanted to measure stable water isotopes in the soil water at our site, where soil moisture is already measured at a temporal resolution of 15 minutes. These measurements were conducted at our three European. In the rest of the article, the experiment conducted at the site Villanueva del Rosario in Spain will be presented and taken as an example.
EXPERIMENTAL WORK
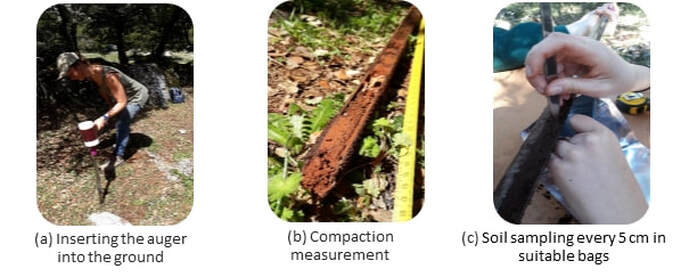
In May 2019 a sampling campaign was carried out at the GloW test site Villanueva del Rosario in Spain. During a week of fieldwork, soil samples were collected with the aim of subsequently analyzing stable water isotopes in soil water. The aim was to collect soil samples at different depths of regular intervals of 5 cm, up to a depth of 50 cm for the forest and 60 cm for the grassland. Using a hand auger, 3 sample profiles were drilled on each plot. This corresponds to a total of 66 samples which were analyzed within a week in the laboratory.
The hand auger has the advantage of being quick and handy. However, the drilling depth is limited and it is easily blocked by rocks. In addition, when the drilling must be repeated several times, the small diameter of the auger becomes a drawback because it requires a lot of time.
For each profile, the sampling was repeated 5 to 10 times in order to collect sufficient soil. In order to be able to carry out the isotope analysis, it was necessary to collect at least 50 g of soil per depth interval and for each profile. In addition, the potential compaction of the soil caused during the extraction of the soil core must be considered. For example: if the auger is introduced into the soil at a depth of 50 cm and after extraction thereof, only 45 cm of soil is measured, samples are taken every 4.5 cm instead of 5 cm.
Finally, the samples were carefully filled into the sampling bags. When closing the bags, it was necessary to expel as much air as possible to avoid interactions between the soil water and the air. Furthermore, in order to avoid any microbial development, which could be the source of change in the isotope content, the samples were stored cool until analysis in the laboratory. Beyond 10 days of storage, water losses and isotopic enrichment due to evaporation can occur (Hendry, 2015). Therefore, samples were analyzed within a week after the field campaign.
ANALYSIS IN THE LABORATORY
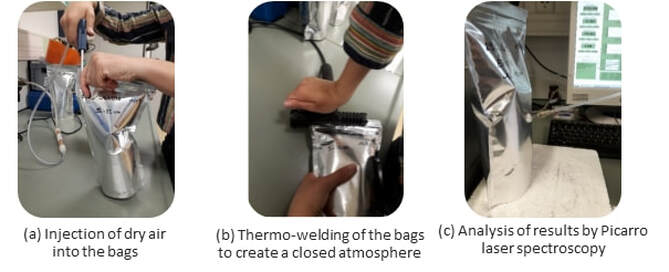
There are various methods for analyzing the isotopic composition of water. We used a laser spectroscopy method based on the equilibrium of H2O (liquid) - H2O (vapor), described for the first time in 2008 (Wassennaar, 2008). This technique makes it possible to obtain the values δ18O and δD by measuring the stable isotopic composition of pore water vapor in a bag containing the soil sample. Direct water vapor equilibration can be described as a method where the pore water of the soil samples is equilibrated with dry air, all in a closed atmosphere, at constant temperature using thermo-welded bags. The time required for the equilibration to be complete has been estimated between 15 and 48 h (Sprenger, 2015). The laboratory analysis procedure is described in Figure 3.
Analysis of stable isotopes of water vapor was carried out using a WS-CRDS spectrometer (Picarro Wavelength-Scanned Cavity Ring Down Spectroscopy). The measurement accuracy for this analysis was 0.27 ‰ for δ18O and 0.74 ‰ for δ2H, respectively. After equilibration (15 to 48 hours), the water vapor of each bag was sampled directly using a needle connected to the continuous flow spectrometer which measures the concentration of δ2H and δ18O in the vapor.
For calibration three reference samples with known concentrations of 18O and 2H were prepared and analyzed at the same time as the soil samples (at the beginning, in the middle and at the end of analysis) (Sprenger, 2015). The values displayed by the spectrometer were then corrected using these reference samples to calibrate our values against the Vienna Standard Mean Ocean Water (VSMOW).
RESULTS
Soil description
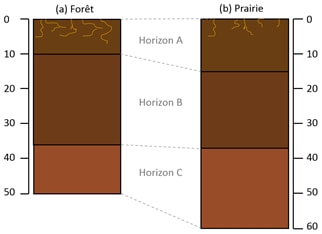
Leptosols are found at the Villanueva del Rosario study site, i.e. shallow soils on hard limestone rock (FAO, 2014). On each of the two plots, a succession of three horizons can be observed whose thickness varies according to the plots. Likewise, the thickness of the different horizons can vary within the same plot (Figure 7).
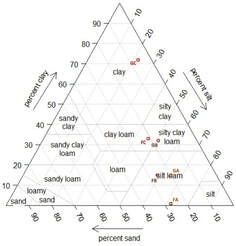
At the grassland plot, the horizon A of soil presents a silty texture and most of the roots can be find until 10 to 15 cm depth. The horizon B has a silty-clayey texture and the horizon C, the deepest reached, is very clayey. It is an alteration zone of the source rock, called Terra Rossa. At the forest plot, the soil is covered with a litter composed of plant debris. The horizon A presents a silty texture with organic content. The horizon B presents also a silty texture. The Terra Rossa with a clayey texture can also be find at the forest plot. Roots are abundant in most of the profiles.
Analysis of the isotopic composition in deuterium
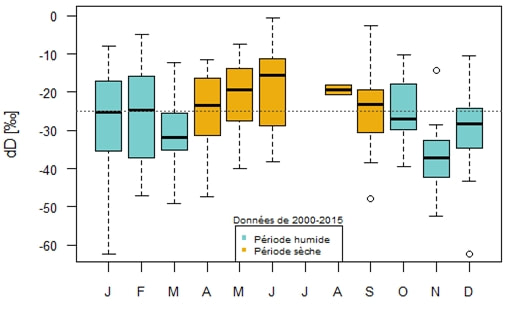
In addition to characterizing evapotranspiration, isotopic analysis can be used to determine the infiltration and recharge rate. To do this, we compare the stable water isotope composition of the soil water with the isotopic composition of the local precipitation in the preceding months. The closest station within the global network GNIP (Global Network of Isotopes in Precipitation) is the Morón de la Frontera station, located some 100 km from the site, with data from 2000 – 2015. Due to its remoteness to our site, the seasonal variations in the isotopic composition at Morón de la Frontera station will only be used in a relative and not quantitative manner. Figure 5 represents the variation of the isotopic composition in deuterium on the site of Morón de la Frontera. This graph was made from all the available data (2000 to 2015). Here, we clearly observe a seasonal variation in the isotopic composition which can be approximated by a sinusoidal function. In summer, the ratio takes higher values than in winter. In fact, since there is less evaporation in winter, δD is generally lower. There is no data in July because no rain has been recorded during this month since the year 2000.
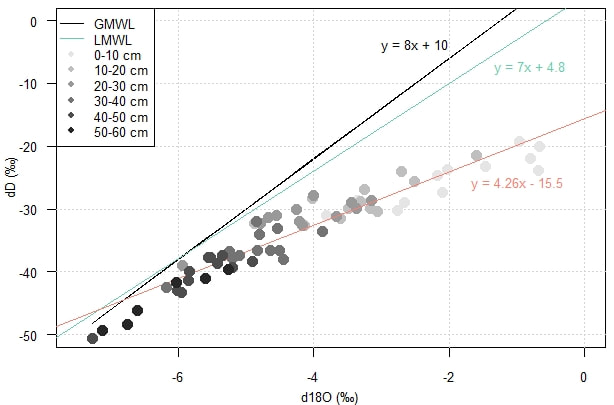
The isotopic compositions measured for each sample with a distinction according to the depth are shown together with the Global Meteoric Water Line (GMWL) in Figure 6. It can be observed that the more the values of δ18O and δD are enriched, the more they deviate from the GMWL. This figure shows that, overall, the more the sample comes from a shallow depth, the more it deviates from the GMWL. This can be explained by evapotranspiration, which occurs more in the first decimetres of the soil than in depth. In addition, a LMWL (Local Meteoric Water Line) was defined from observations made at the Morón de Frontera station. This straight line, more representative of the Mediterranean climate, confirms the presence of evapotranspiration in the upper part of the soil.
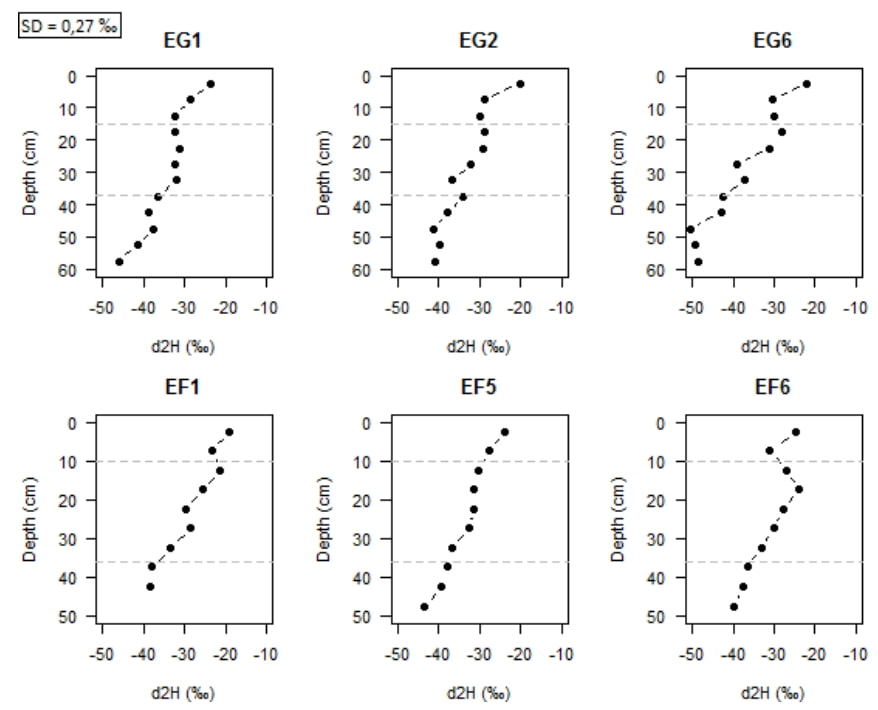
In the following, only the isotopic composition in deuterium is shown because in laser isotopic spectrometry the relative precision of the measurement is higher for δD than for δ18O. In addition, deuterium is less sensitive to the effects of kinetic fractionation such as evaporation (Garvelmann, 2012). In Figure 7 a similar trend for all profiles can be observed, without any real distinction between the plant cover.
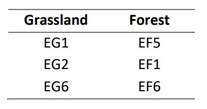
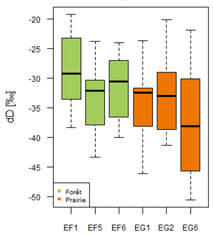
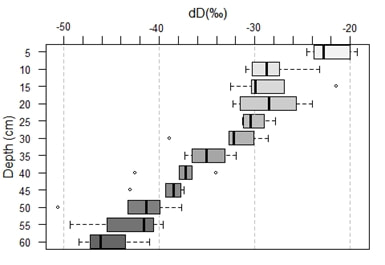
The proportion of hydrogen 1H increases with depth since δ2H decreases. Due to evaporation, enrichment of heavy isotopes in the subsoil may occur in the upper part of the soil column (Zimmermann, 1967; Allison, 1984). Indeed, hydrogen, lighter than deuterium, evaporates and therefore, δD increases compared to hydrogen. This trend is confirmed by Figure 9, especially in the first 5 centimeters where δD is much more enriched than in depth. We can also observe heterogeneities within the plots (Figure 8): the profile EG6 located in the meadow is more depleted unlike the profile EF1 located in the forest, more enriched.
INTERPRETATION OF ISOTOPE PROFILES
We can clearly observe a seasonal variation with precipitation enriched with heavy isotopes in summer and more depleted in winter (Figure 5). This is due to the fact that stable isotopic ratios are strongly correlated with air temperature (Clark & Fritz, 1997). For this study it means, we should theoretically have: soil water from originating from recent precipitation near the surface and an increasing proportion of soil water from winter precipitation with increasing soil depth. However, this hypothesis cannot be confirmed without measuring precisely the rainfall isotopic signal directly at the study site. This is why it is planned to set up a device to collect monthly precipitation at the study site. So the isotopic signal of rain can be reconstructed more precisely, particularly for the next sampling campaign which will take place next winter.
Furthermore, the absorption of water by plants and hydrodynamic dispersion can modify the meteoric input signal in the unsaturated zone (Barnes, 1998). These processes result in an attenuation of the isotopic precipitation signal with depth (Garvelmann, 2012). Thus, the isotopic composition of interstitial water (δ2H and δ18O) constitutes a natural tracer of precipitation infiltration into the soil. It can be used to determine the origin, and the mixing of different waters (Hendry, 2015). However, in the case of our profiles, a final interpretation can only be proposed when the isotopic compositions of the rains on the study site are available. A device to collect rain water at the study site was installed. So, after the next sampling campaign the isotopic composition of the soil water can be directly compared to that of the rain water.
In the form of vertical profiles, the analysis of the soil water isotopic composition could allow us to make a first approach of the mechanisms of the unsaturated zone. The isotopic signal of precipitation could not be traced directly, but we could still observe a deuterium depletion for the deepest samples, which we assume to be related to winter precipitation. Also, the impact of evaporation on the first decimeters of the ground was detected.
REFERENCES
Allison, G. B., Barnes, C. J., Hughes, M. W., and Leaney, F .W. (1984): ‘Effect of climate and vegetation on oxygen-18 and deuterium profiles in soils’, in: Proceedings of the IAEA Symposium on Isotope Hydrology 1983, edited by: IAEA, IAEA, Vienna, Austria, 105–122
Clark, I and Fritz, P. (1997) Environmental Isotopes in Hydrogeology. CRC Press, New York, 328 p.
FAO. (2014, mis-à-jour 2015): Base de référence mondiale pour les ressources en sols, in: Rapport sur les ressources en sols du monde n°106, ISBN 1020-430X.
Garvelmann J., Kulls C., and Weiler M. (2012): ‘A porewater-based stable isotope approach for the investigation of subsurface hydrological processes’, Hydrol. Earth Syst. Sci., 16, 631–640.
Hendry MJ, Schmeling E, Wassenaar LI, Barbour SL, Pratt D. (2015): ‘Determining the stable isotope composition of pore water from saturated and unsaturated zone core: improvements to the direct vapor equilibration laser spectroscopy method’. Hydrology and Earth System, Sciences Discussions 12: 6241–6274.
Sprenger, M., Herbstritt, B., Weiler, M. (2015): ‘Established methods and new opportunities for pore water stable isotope analysis’, Chair of Hydrology, Faculty of Environment and Natural Resources, University of Freiburg, Freiburg, Germany
Sprenger, M., S. Seeger, T. Blume, and M. Weiler (2016). ‘Travel times in the vadose zone: Variability in space and time’, Water Resour. Res., 52, 5727–5754, doi:10.1002/2015WR018077.
Wassenaar, L. I., Hendry, M. J., Chostner, V. L., and Lis, G. P. (2008): ‘High resolution pore water delta deuterium and oxygen-18 measurements by water (liquid)-water (vapor) equilibration laser spectroscopy’, Environ. Sci. Technol., 42, 9262–9267.
Zimmermann, U., Ehhalt, D., and Munnich, K. O. (1967): ‘Soil-water movement and evapotranspiration: changes in the isotopic composition of the water’, in: Proceedings of the IAEA Symposium on Isotope Hydrology, edited by: IAEA, IAEA, Vienna, Austria, 567–585.
Research project funded by the German Research Foundation

